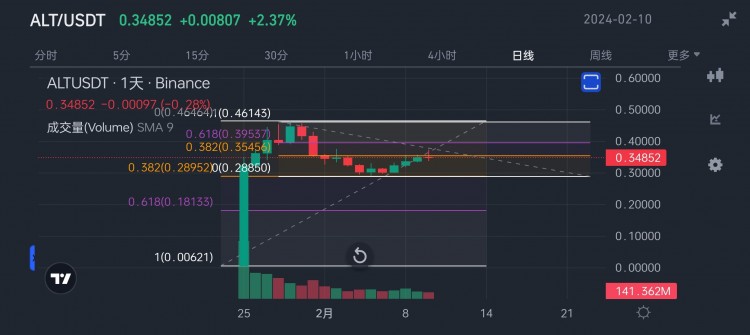
How to use Fibonacci’s golden ratioThe golden ratio of 0.382 and 0.618 can be used as resistance/support levels to measure an up/down trend.But it’s not just about measuring a period, but it changes according to market changes. Take the current daily K trend of as an exampleThe 0.382 support level in the previous rising market was perfectly reached, but this does not mean that the market will break the previous high after the support is completed (a callback of 0.382 instead of 0.618 is regarded as a strong market, and the same is true for the falling market)At this time, in the recent retracement of the market, we need to pull out another period of Fibo tool to test the resistance position of this retracement of the market, and then observe the resistance breakthrough in small cycles step by step

热点: FOR GOLDEN RATIO
