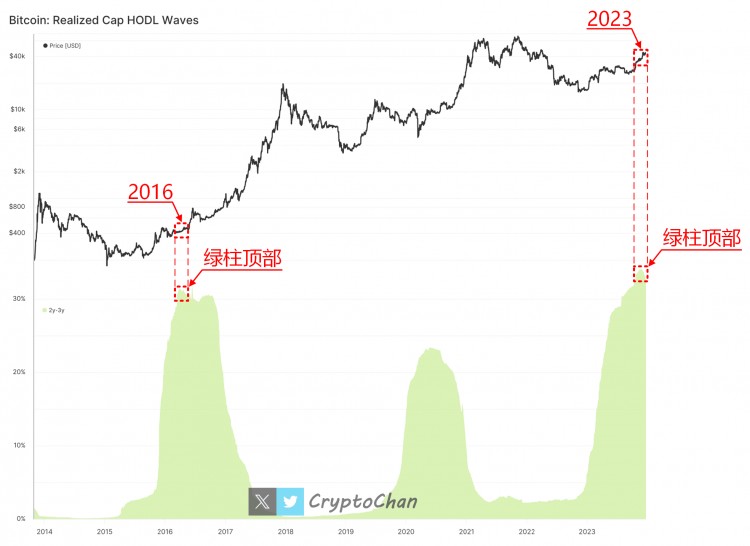
The top of the current green column may have formed, marking 2016.The black line at the top of the figure is the price of BTC; the green column at the bottom is the number of BTC that has not moved on the chain for 2-3 years as a percentage of the total circulation of BTC (the number of BTC in different age groups needs to be calculated during the calculation process). Weighted by the total market value of BTC buying costs in this age group).


![[币圈新韭菜]Collective Shift创始人:比特币已形成局部底部,并正走向上升趋势](/img/btc/26.jpeg)


